Chapter 3 Metro Data Warehouse Contents
3.1 Crosswalks and Classifications
Researchers across the Metro programs produce analyses using many of the same geographical, industry, or occupation classifications. The Metro data warehouse will contain the definitions for the most commonly used geography, industry, and occupation groups, as well as crosswalks to align changes in these groups across time.
3.1.1 Geographic Correspondence file
county_cbsa_st.csv
This geographic correspondence file links the following units: County, Core Based Statistical Area (CBSA) and State. Each row is a unique county, plus the CBSA and the State that it is located in, with columns containing identifiers, names, population and employment for each geographic entity.
3.1.2 Geographic crosswalks
Metro users also often have to assign data available at one geography to another. In order to ensure consistency in the method for allocating data, a common set of continuously-updated crosswalks are available in the data warehouse. All geographic crosswalks are generated through Missouri Census Data Center Geographic Correspondence Engine (Geocorr 2018). Right now you can find the following crosswalks in the data warehouse:
- tract2place: Census Tract to Place (City, Town, Village, CDP, etc.)
- zcta2county: ZCTA to County
- place2county: Place (City, Town, Village, CDP, etc.) to County
- puma2county: PUMA to County
If users find they need crosswalks that are not already available in the data warehouse, they may do so using the MABLE geocorrespondence engine using 2016 population as the weighting variable. Instructions on how to generate crosswalks from this engine are available here
3.1.3 NAICS Hierachical Correspondence file
The North American Industry Classification System (NAICS) is an industry classification system that groups establishments into industries based on the similarity of their production processes. The structure of NAICS is hierarchical. NAICS uses a six-digit coding system to identify particular industries and their placement in this hierarchical structure of the classification system. The first two digits of the code designate the sector (i.e. 33, manufacturing), the third digit designates the subsector (i.e. 336, transportation equipment manufacturing), the fourth digit designates the industry group (i.e. 3361 motor vehicle manufacturing), the fifth digit designates the NAICS industry (i.e. 33611, automobile and light duty motor vehicle manufacturing), and the sixth digit designates the national industry (i.e. 336111, automobile manufacturing). A zero as the sixth digit generally indicates that the NAICS industry and the U.S. industry are the same.
This is a hierarchical relationship file for 6-, 5-, 4-,3-, and 2-digit NAICS 2017 codes. Each row is a 6-digit NAICS industry, and the sectors and subsectors it belongs to.
3.1.4 NAICS Historical Correspondence file
NAICS is scheduled to be reviewed and revised every five years to keep pace with the changing economy. This is a historical correspondence file that tracks NAICS revisions from 1997 to 2017. An allocation factor (afact) is generated by share of a NAICS industry’s employment in the vintage year that maps to a revised NAICS code.
3.1.5 Other Industry Classifications
Advanced industries: An industry grouping defined by Mark Muro’s work on technology, competitiveness, and job growth. Formally:
R&D- and STEM-worker intensive advanced industries encompass the nation’s “tech” sector at its broadest and most consequential. Such industries anchor the U.S. economy, support opportunity in other sectors, and have led the post-recession employment recovery. Their future competitiveness and growth are prerequisites for broadly shared prosperity.
Tradable industries: A classification that determines whether an industry produces output that is primarily exported (traded) or remains within the region (local-serving). Formally, from Michael Porter’s U.S. Cluster Mapping Project:
Traded industries are industries that are concentrated in a subset of geographic areas and sell to other regions and nations. Local industries are industries present in most (if not all) geographic areas, and primarily sell locally.
3.1.6 SOC Hierarchical Correspondence File
The 2018 Standard Occupational Classification (SOC) system classifies all workers into 867 detailed occupations, which are combined to form 459 broad occupations, 98 minor groups, and 23 major groups.
Occupational Information Network is a regularly updated database of information outlining occupational characteristics and worker requirements. Based on the Standard Occupational Classification external site, the O*NET-SOC taxonomy currently includes 974 occupations, which currently have, or are scheduled to have.
3.1.7 SOC Historical Correspondence file
This is a historical correspondence file that tracks SOC revisions in 2000, 2010 and 2018.
3.1.8 Other Classifications
Digitalization level: From Mark Muro’s work on the changing digital skill and importance content of occupations across time.
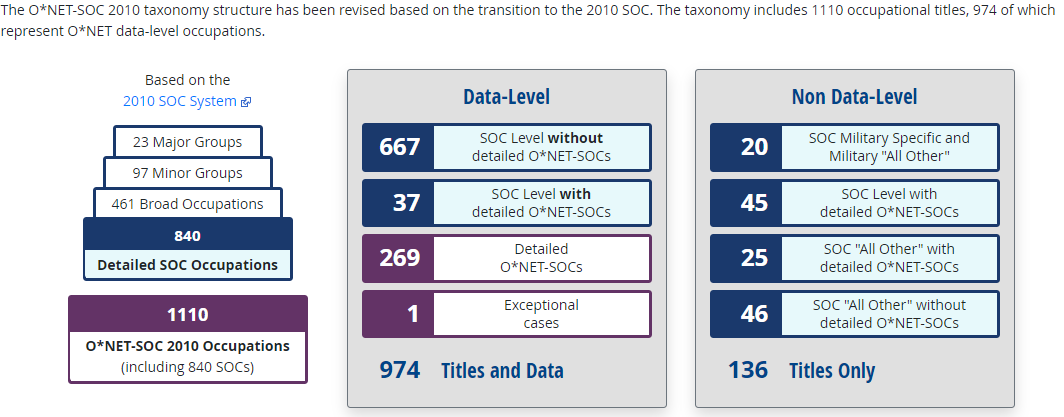
Figure 3.1: O*NET-SOC 2010 taxonomy structure
3.2 Metro-Generated Datasets
This is a shared folder for final datasets from select Metro research products or interim datasets that we commonly reference in presentations or deploy in place-based engagements. These structured datasets all follow Metro dataset standards, allowing for easier navigation and necessary wrangling.
## -- access across america
## -- acs5_2017
## -- acs5_2018
## -- biz_rd
## -- broadband
## -- digitalization
## -- export_monitor
## -- housing_price
## -- inc5000
## -- job_density
## -- low_wage_worker
## -- metro_monitor_2019
## -- metro_monitor_2020
## -- millenials diversity
## -- oecd_patent
## -- old_industrial_cities
## -- opportunity industries
## -- out_of_work
## -- patent_complexity
## -- school proficiency
## -- univ_licensing
## -- univ_rd
## -- univ_rd_detail
## -- uspto
## -- vc
3.2.1 Local Copies
## -- 2017 ACS
## -- 2018 ACS
## -- BEA GDP 2001 - 2018
## -- CBP EMP
## -- chetty opportunity
## -- Emsi
## -- LEHD LODES - Shortcut.lnk
## -- oxford_global_metros
3.2.2 Digital Access
Contact data owners for credentials
AUTM-STATT databaseexpired- Sifan: Crunchbase
- Sifan: EMSI. See 6 for EMSI usage notes
- Tracy: Costar
3.3 Spatial Data
Spatial data is a crucial component of most Metro research. Spatial data files will be stored in the data warehouse to ensure all researchers are using the latest geographic designations (these files will be updated concurrently with any geographic definition changes, given they are available) and to reduce redundancy in the number of large files. These files will be sourced primarily from the Census Bureau, and secondarily from Esri where Census Bureau files are not available. Basemaps and shapefiles in the data warehouse will be saved un-projected, in order to easily merge with lat/long point data in ArcMap. Two types of shapefiles and basemaps are available:
.shpetc, can be used in ArcMap or with R/Python,.mxd, for use in ArcMap only
The data warehouse currently provides shapefiles for counties, metros, and states for lower 48 states with AK/HI insets. Check Metro Map Guidelines
## -- basemaps
##    |__2018
##       |__insets
##          |__cbsas51_hd_basemap.mxd
##          |__counties51_hd_basemap.mxd
##          |__metros51_hd_basemap.mxd
##          |__states51_hd_basemap.mxd
##          |__top100metros_hd_basemap.mxd
##       |__no_insets
##          |__cbsas49_hd_basemap.mxd
##          |__counties49_hd_basemap.mxd
##          |__metros49_hd_basemap.mxd
##          |__README_top100_basemap_noinsets.txt
##          |__states49_hd_basemap.mxd
## -- README.pdf
## -- README.pptx
## -- shapefiles
##    |__2018
##       |__insets
##          |__cbsas
##          |__counties
##          |__metros
##          |__states
##          |__top100metros
##       |__no_insets
##          |__cbsas
##          |__counties
##          |__metros
##          |__states
##          |__top100metros
## -- Thumbs.db